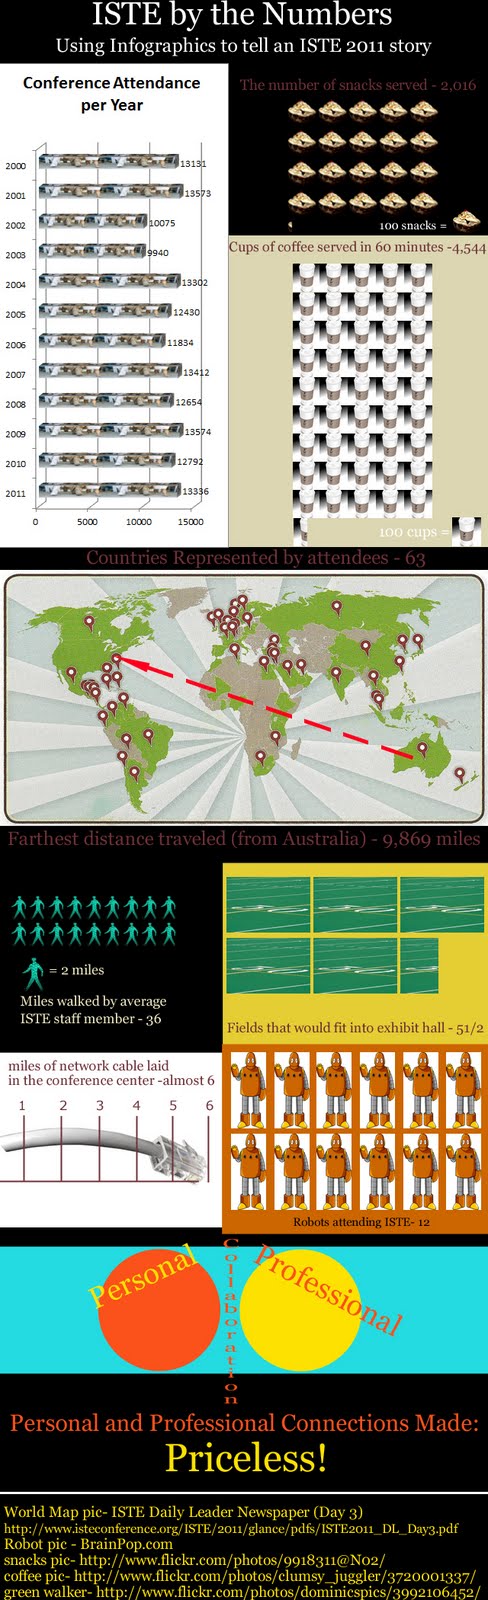
So, I was lucky enough to be able to spend last week at the 2011 ISTE conference in Philadelphia. I, like most everyone else that was there, enjoyed running around looking at all the different aspects of the conference. One of the sessions I went to was about Infographics. Basically, infographs are a way to show numbers or details in a graphic nature. Any graph can be considered an infographic; but; they are usually much more involved than that. The picture on the left is my first shot at creating an infographic using numbers from ISTE 2011. The infographic has been updated to show the latest numbers put out from ISTE. You can click on the picture to see it larger or...
This link is to a site called zoom.it which allows you to zoom into any picture. It will allow you to zoom in and out of the infographic, as well as move around the picture, in more detail. So, on top of the infographic, you get a cool website as well - wow, 2 for the price of 1!


